Français (France)
  Finnish (FI)
  English (United Kingdom)


Please note that simulation actions require a simulation plan.
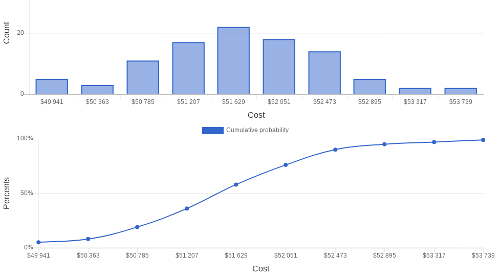
You can view simulation results in the project view by clicking on 'Show simulation results' button. Display shows histograms and cumulative probabilty distribution curves for total project cost and duration. Histogram shows how many times total project cost or duration falls into certain interval and cumulative distribution curve shows the probability to stay below a certain total project cost or duration.
Duration is calculated as calendar duration and it is shown with the corresponding project end time.
Attached picture shows how to view results for total project cost.
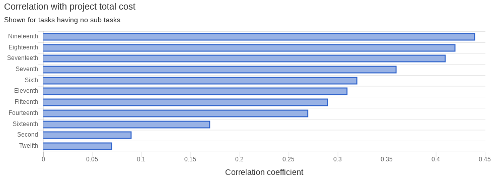
Pearson correlation coefficients for cost and duration are calculated for each task having no sub tasks. Coefficient shows how much project's total cost or duration depends on the cost or duration of each task. Coefficient can have values between -1 (maximum reverse correlation) and +1 (maximum positive correlation). Select 'Show tornado chart' before showing simulation results to see the coefficients. Attached picture shows correlation coeffcients for cost.
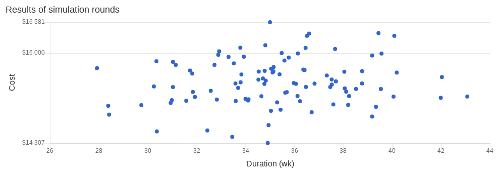
Scatter chart shows the result (cost and duration) of each iteration round. Number of hits shown in the chart depends on the number of simulation rounds set for the project.