 Français (France)
  Finnish (FI)
  English (United Kingdom)


First Mars flight is approaching. Let's see how to plan the final phase with MonteCarloProject.
We are on the 1st of January 2025. OK, a bit optimistic, but let's go on. The WBS (work breakdown structure) for the MARS1 project consisting of final preparations and checks for the first Mars flight is shown on the picture 1.
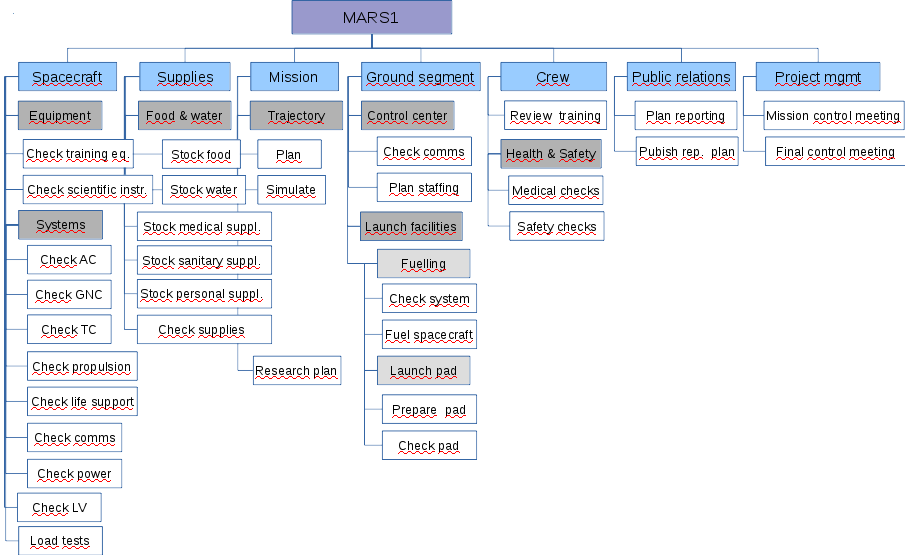
Picture 1. WBS for MARS1 project.
AC = attitude control
GNC = Guidance, navigation and control
TC = Thermal control
LV = Launch vehicle
We need to give cost and duration probability distributions and related parameters for each task in the MARS1 project in order to simulate how much this final phase would cost and how long it would take. Following table shows these distributions and parameters.
Table 1. Probability distributions and related parameters for MARS1 project's tasks.
| Name | Distribution | Cost | Duration | ||||||||||
| Minimum | Most probable | Maximum | Stand. dev. | Minimum | Most probable | Maximum | Stand. dev. | ||||||
| Spacecraft | |||||||||||||
| Equipment | |||||||||||||
| Check training eq. | Normal | $200 | $100 | 1 | d | 4 | h | ||||||
| Check scientific instr. | Beta | $700 | $1 000 | $5 000 | 3 | d | 1 | w | 5 | w | |||
| Systems | |||||||||||||
| Check attitude control | Normal | $200 | $100 | 1 | d | 4 | h | ||||||
| Check GNC | Beta | $200 | $300 | $1 500 | 1 | d | 2 | d | 2 | w | |||
| Check thermal control | Beta | $300 | $500 | $2 500 | 2 | d | 3 | d | 3 | w | |||
| Check propulsion | Beta | $300 | $500 | $2 500 | 2 | d | 3 | d | 3 | w | |||
| Check life support | Beta | $700 | $1 000 | $4 000 | 3 | d | 1 | w | 4 | w | |||
| Check comms | Triangular | $500 | $700 | $3 500 | 2 | d | 3 | d | 3 | w | |||
| Check power | Beta | $700 | $1 000 | $3 000 | 3 | d | 1 | w | 3 | w | |||
| Check launch vehicle | Triangular | $300 | $500 | $2 500 | 2 | d | 3 | d | 3 | w | |||
| Load testing of structures | Beta | $300 | $500 | $1 500 | 2 | d | 3 | d | 2 | w | |||
| Supplies | |||||||||||||
| Food & water | |||||||||||||
| Stock food | Beta | $300 | $500 | $1 000 | 2 | d | 3 | d | 1 | w | |||
| Stock water | Beta | $300 | $500 | $1 000 | 2 | d | 3 | d | 1 | w | |||
| Stock medical supplies | Beta | $700 | $1 000 | $2 000 | 3 | d | 1 | w | 2 | w | |||
| Stock sanitary supplies | Beta | $700 | $1 000 | $2 000 | 3 | d | 1 | w | 2 | w | |||
| Stock personal supplies | Beta | $700 | $1 000 | $2 000 | 2 | d | 3 | d | 1 | w | |||
| Check supplies | Beta | $700 | $1 000 | $2 000 | 3 | d | 1 | w | 2 | w | |||
| Mission | |||||||||||||
| Trajectory | |||||||||||||
| Plan | Triangular | $1 000 | $2 000 | $6 000 | 1 | w | 2 | w | 6 | w | |||
| Simulate | Triangular | $700 | $1 000 | $3 000 | 3 | d | 1 | w | 3 | w | |||
| Review research plan | Normal | $500 | $100 | 3 | d | 1 | d | ||||||
| Ground segment | |||||||||||||
| Control center | |||||||||||||
| Check comms | Triangular | $700 | $1 000 | $4 000 | 3 | d | 1 | w | 4 | w | |||
| Plan staffing | Normal | $300 | $100 | 2 | d | 1 | d | ||||||
| Launch facilities | |||||||||||||
| Fuelling | |||||||||||||
| Check system | Normal | $300 | $100 | 2 | d | 1 | d | ||||||
| Fuel spacecraft | Beta | $100 | $200 | $1 000 | 4 | h | 1 | d | 1 | w | |||
| Launch pad | |||||||||||||
| Prepare pad | Triangular | $1 000 | $2 000 | $8 000 | 1 | w | 2 | w | 8 | w | |||
| Check pad | Beta | $700 | $1 000 | $4 000 | 3 | d | 1 | w | 4 | w | |||
| Crew | |||||||||||||
| Review training | Normal | $2 000 | $500 | 2 | w | 1 | w | ||||||
| Health & safety | |||||||||||||
| Safety checks | Normal | $300 | $100 | 2 | d | 1 | d | ||||||
| Medical checks | Beta | $700 | $1 000 | $3 000 | 3 | d | 1 | w | 3 | w | |||
| Public relations | |||||||||||||
| Plan reporting | Normal | $500 | $100 | 3 | d | 1 | d | ||||||
| Publish reporting plan | Normal | $300 | $100 | 2 | d | 1 | d | ||||||
| Project management | |||||||||||||
| Mission control meeting | Beta | $4 000 | $5 000 | $20 000 | 5 | h | 1 | d | 4 | d | |||
| Final control meeting | Beta | $4 000 | $5 000 | $15 000 | 4 | h | 1 | d | 3 | d |
In the MARS1 project task specific probability distributions fall into one of the following types:
- Beta-PERT distribution (simply 'Beta' in the table)
- Normal distribution
- Triangular distribution
Probability distributions are characterized by following parameters:
- minimum, most probable and maximum cost and duration for beta-PERT and triangular distributions
- most probable cost and duration and their standard deviation for the normal distribution
For example majority of the tasks in spacecraft system checks might cost much more and last a lot longer than the most probable cost or duration, but the minimum cost and duration are quite close to the most probable estimates. Same applies to communication checks and launch pad related tasks in the 'Ground segment' section.
Following schedule (picture 2) shows task dependency relationships (i.e. predecessors and successors), which are also required for simulating the project duration.

Picture 2. MARS1 schedule.
We can see that tasks under 'Spacecraft', 'Supplies', 'Mission' and 'Ground segment' need to be done before the 'Mission control meeting'. After the meeting tasks related to 'Public relations' and 'Crew' can be done. They are followed by the 'Final control meeting'.
Let's look at the results after running the Monte Carlo simulation with 500 rounds in MonteCarloProject. MARS1 project's total cost and duration distributions are shown in pictures 3 and 4. A separate article highlights the use of Monte Carlo method in project modeling.
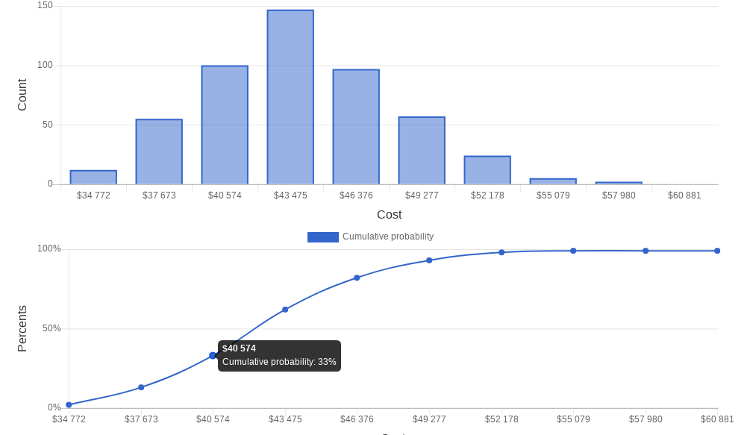
Picture 3. Histogram and cumulative probability curve for MARS1 project's cost.
Having a look at the cumulative probability curve in picture 3 we can see that there's a 33% probabilty of project costing no more than roughly $40 500 and a very high probability (98%) of project's total cost staying under roughly $52 000.
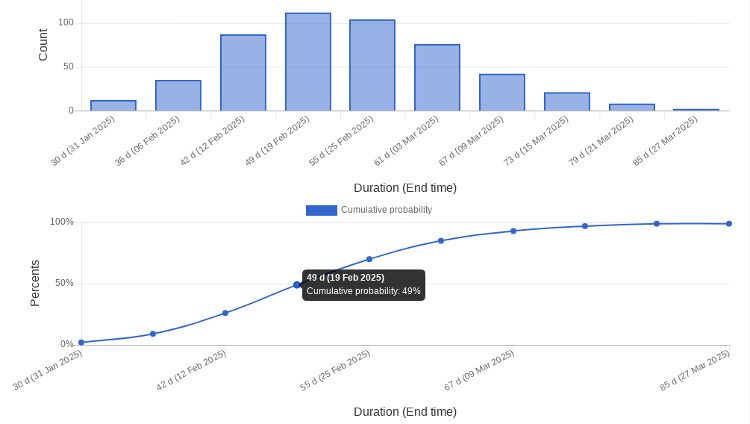
Picture 4. Histogram and cumulative probability curve for MARS1 project's duration.
Having a look at the cumulative probability curve in picture 4 we can see that there's a 49% probabilty of project finishing by the 19th of February 2025 and a very high probability (97%) of it finishing by the 15th of March 2025. Information is useful when targeting a certain launch window.
MonteCarloProject shows also the hits (cost and duration) for each simulation round in a scatter chart (see picture 5).
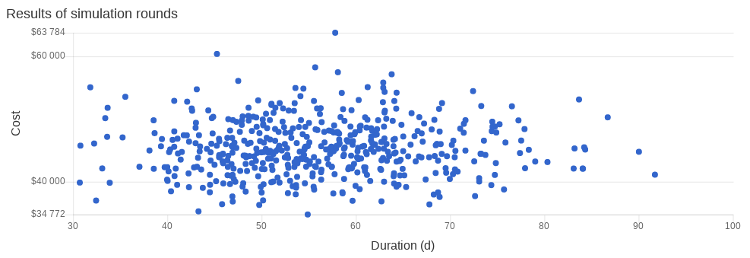
Picture 5. Results of MARS1 project's simulation rounds.
Scatter chart is useful when finding out a probability of staying simultaneously below a certain total cost and duration for the MARS1 project.
Bon voyage!